Dashboard
Your Dashboard provides an at-a-glance view of your overall performance and session history.
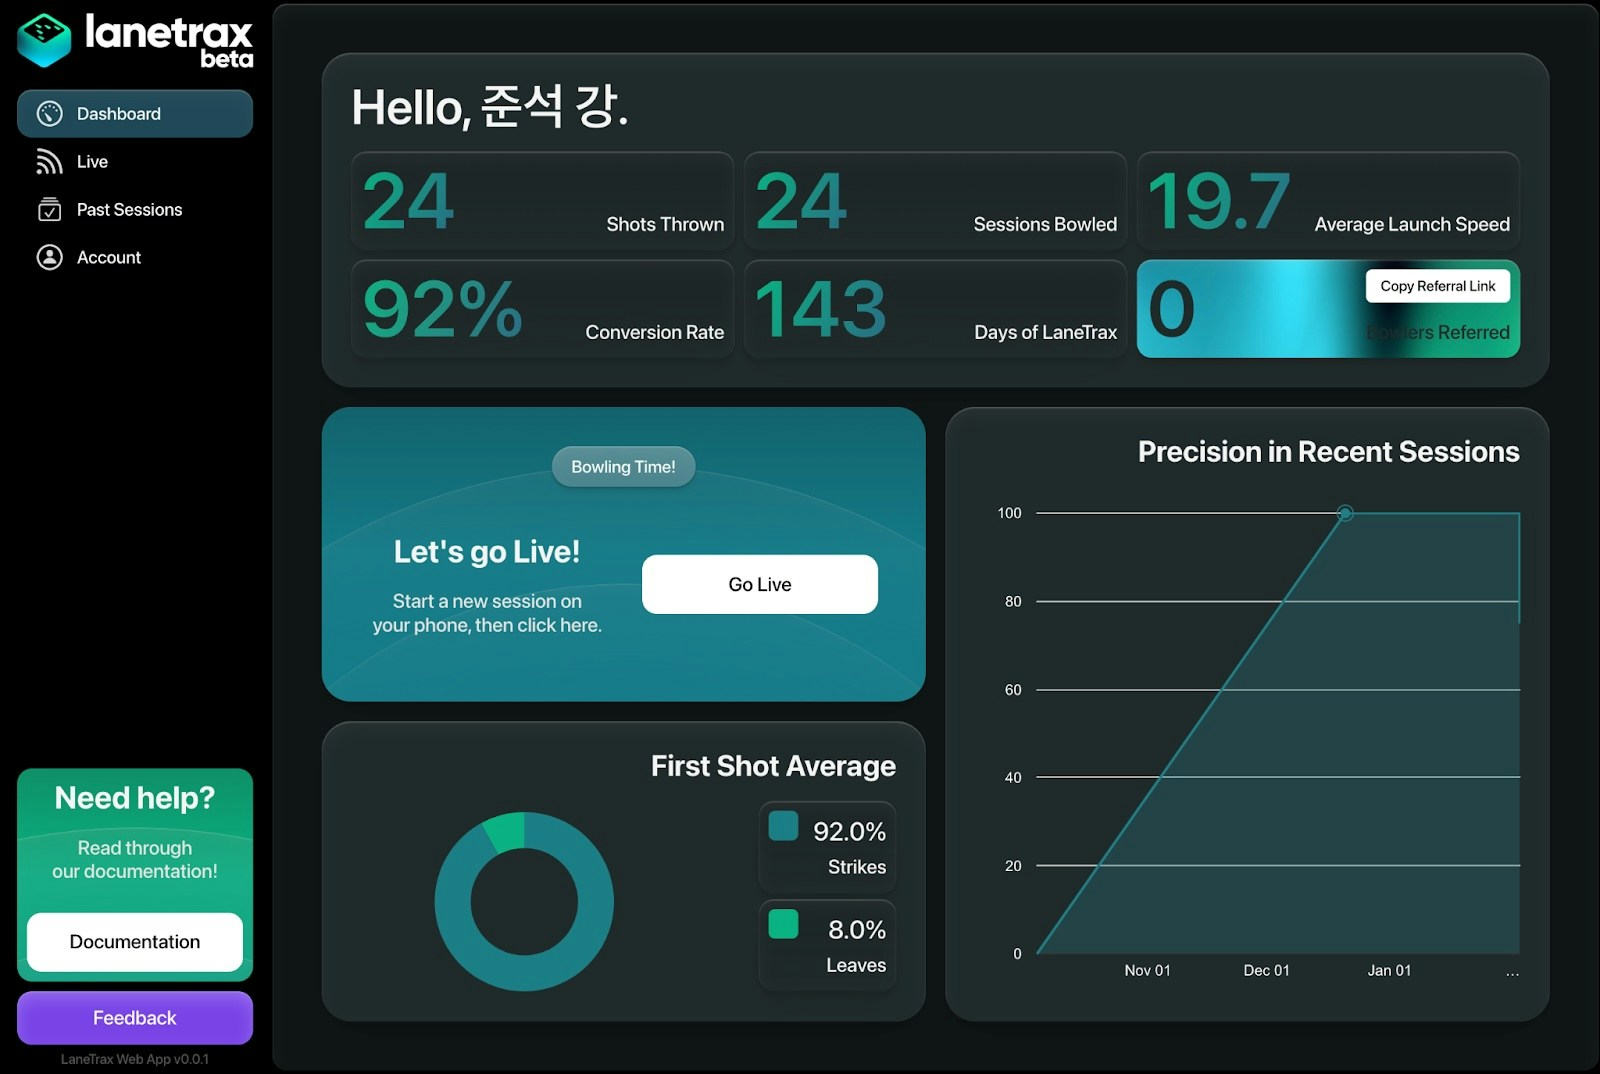
Key Statistics
- Shots Thrown: Total number of recorded shots.
- Sessions Bowled: Total sessions completed.
- Average Launch Speed: Average speed at ball release.
- Conversion Rate: Percentage of shots meeting performance goals.
- Active Days: Number of days using LaneTrax.
- Referrals: # of new users referred via your link.
- First Shot Average: Consistency of your initial throw each session.
- Precision Trends: Variations in accuracy across sessions.
Hover over charts to see detailed metrics and trend breakdowns.